Spectrum Analyzers for Linux
When it comes to audio production on Linux, finding high-quality visualization tools can sometimes be a challenge. Fortunately, two spectrum analyzers—EasySSP and ToneBoosters Spectrogram—stand out for their precision, user-friendly design, and cross-platform availability.
Whether you’re mixing music, mastering, or performing sound design, these tools can give you the detailed insight your ears alone might miss.
Below is an overview of both analyzers and what makes them valuable in a Linux-based studio environment.
EasySSP: Lightweight, Free, and Surprisingly Capable
EasySSP is a free, open-source spectrum analyzer plugin that provides clean, responsive visual feedback without unnecessary complexity. It’s a popular choice among Linux users because it is:
- Linux-Native
- EasySSP is available as LV2 and VST2, making it compatible with nearly all major Linux DAWs
Since it’s open-source, it integrates smoothly into the Linux ecosystem without special setup.
Clear and Minimalist Interface
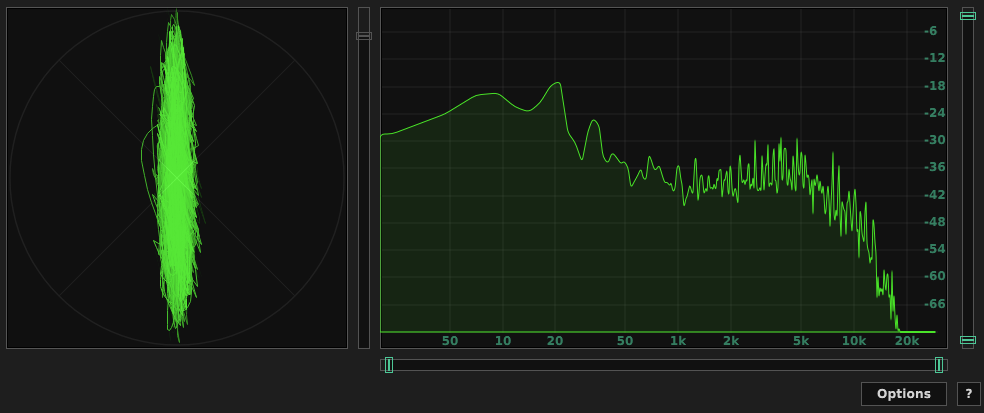
EasySSP focuses on just what you need:
- Real-time spectrum analyzer
- Stereo and mid/side levels
- Peak meter
- Configurable FFT sizes
- Adjustable falloff behavior
It opens quickly, uses little CPU, and works reliably, which makes it ideal for both older machines and resource-heavy sessions.
Who It’s Best For
If you want a simple, accurate, no-frills analyzer that works perfectly on Linux, EasySSP is an excellent match.
https://distrho.sourceforge.io/ports.php
ToneBoosters Spectrogram
ToneBoosters Spectrogram is part of ToneBoosters' suite of professional audio tools. Unlike EasySSP’s minimal approach, Spectrogram is built for detailed, in-depth analysis—a powerful tool for engineers who want a deeper look into their audio.
Cross-Platform Plugin With Linux Support
ToneBoosters plugins aren’t officially Linux-native, but many of them—including Spectrogram—run extremely well under Linux via Carla, yabridge, or REAPER's built-in plugin bridging. Linux users commonly run the VST versions without issues.
This gives you access to a high-end spectrum analyzer even if you’re working outside macOS/Windows.
Advanced Features
ToneBoosters Spectrogram goes beyond traditional spectrum analyzers with:
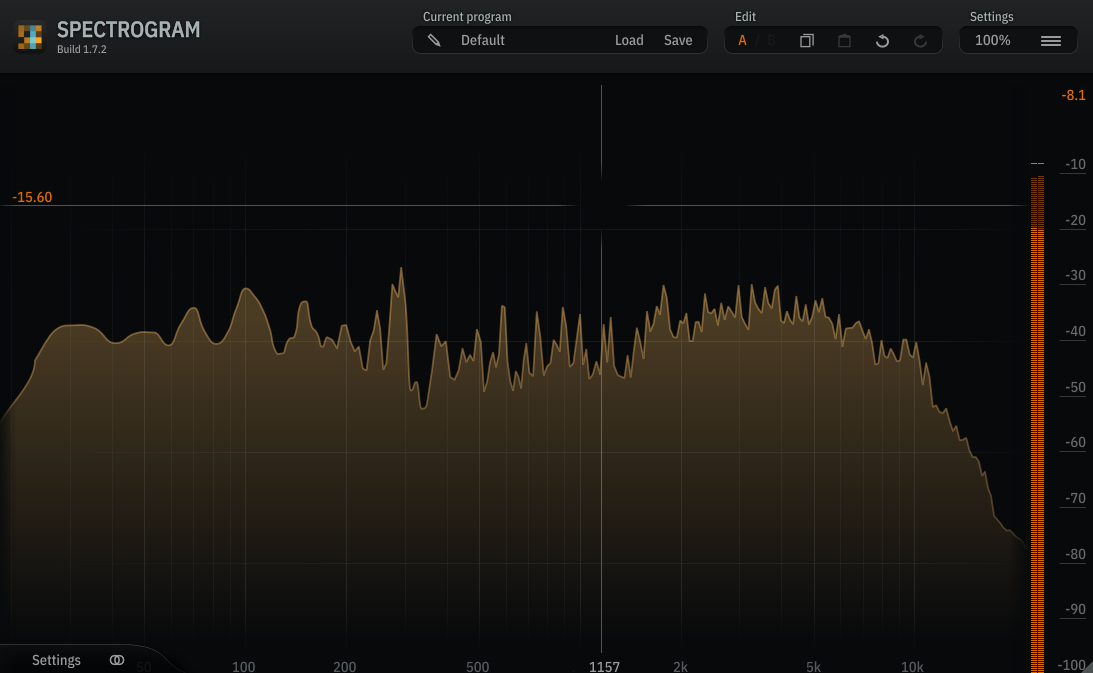
- 2D and 3D spectrogram views
- Adjustable time and frequency resolution
- Waterfall displays
- Harmonic analysis
- Custom color maps
- Freeze and compare modes
- Oversampling for precision
It’s also highly optimized, so even the more complex visualizations run smoothly.
Who It’s Best For
If you’re doing sound design, mastering, forensic audio, restoration, or educational work, ToneBoosters Spectrogram offers a depth of visualization you won’t get from simpler tools.
https://www.toneboosters.com/tb_spectrogram_v1.html
Socalabs
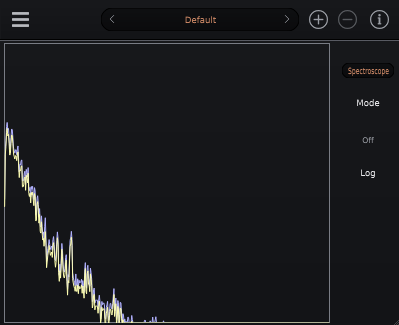
SoCalabs has built a reputation for producing high-quality, intuitive audio tools, and the Spectrum Analyzer plugin is no exception. Here’s why it’s quickly becoming a go-to for professionals in both studio and live settings.
- Crystal-Clear Visual Display
One of the standout features of the SoCalabs Spectrum Analyzer is its crystal-clear, intuitive visual display. With its easy-to-read interface, you get an immediate understanding of your sound’s frequency spectrum. The display is highly responsive and offers a real-time visualization of your signal, so you can monitor your frequencies as they change during the performance or production process.
You can view frequency data across different ranges—from the low end (20 Hz) all the way to the high frequencies (20 kHz), giving you an accurate snapshot of how your audio fills the sonic space. The visual presentation is clean and customizable, with options to adjust color schemes, resolution, and display modes to suit your workflow.
- Real-Time, Dynamic Frequency Analysis
The SoCalabs Spectrum Analyzer offers real-time frequency analysis, meaning you can see how the audio spectrum shifts as your sound changes over time. This feature is especially useful when you’re making adjustments to individual tracks or your overall mix. It allows you to immediately identify which frequencies are present at any given moment and how they interact with each other.
For example, if you notice your low end is a little too muddy or there’s a harsh midrange frequency that's cutting through too aggressively, you can make changes and instantly see the effect on the spectrum in real time.
- Flexible Customization Options
Every producer, musician, and sound engineer works differently, and the SoCalabs Spectrum Analyzer is built with that in mind. The plugin offers a range of customization options, letting you tailor the display and functionality to fit your specific needs.
You can adjust:
Frequency Range: Focus on specific ranges (like low, mid, or high frequencies) depending on your needs.
Smoothing: Control how much the display smooths out the frequency data, allowing you to focus on broader trends or zoom in on minute details.
Peak Hold: Freeze the peak levels for easy monitoring of the loudest frequencies.
Display Mode: Choose between various modes, including "bars" or "lines," to visualize the data in the most useful way for your workflow.
These options allow you to adapt the Spectrum Analyzer to whatever your project requires, whether you're working on a precise EQ adjustment or just want an overall view of your mix.
https://socalabs.com/analysis/spectrumanalyzer/
Final Thoughts
Linux audio production is stronger than ever, and tools like EasySSP and ToneBoosters Spectrogram show that you don’t need to compromise on quality when working outside mainstream proprietary systems. Whether you need a fast and simple analyzer or a professional-grade spectrogram tool, these two options cover a wide range of workflows.